
This Market Pays Proof and Sells Promises.
Market Recap — August 2nd 2026 · The Philosopher Investor


Hello my friends,
Three of the twelve Fed voters asked for a hike on Wednesday. Kevin Warsh closed the press conference with “This Fed will not waver,” and the market believed him for exactly one session: the Dow lost 1,153 points, its worst day since April 2025. Then Microsoft reported Azure’s first $100 billion year, Amazon reported AWS growing 37%, its fastest in four years, and the fear was gone. The index closed the week up 1.1%, as if Wednesday had never happened.
Four giants reported this week and the market ran the same test on each: show the revenue. Microsoft and Amazon showed it and gained 15% in a day. Meta raised its spending plan to as much as $145 billion with free cash flow near zero and was sold before the next open. Apple beat its quarter, guided soft, and lost 7% on Friday. Alphabet, which I bought into last week’s panic, rose 11% once its peers proved that cloud spending turns into cloud revenue. The rule this market applies is simple. It pays for proof and it sells promises. Everything below is a version of that rule, so keep it in mind as you read.
The weekend then added two more promises to grade. First the yen:

Japan sold an estimated $59 billion of dollars on Thursday to defend its currency, which had fallen to ¥162.84, its weakest since 1986. On Friday Washington joined in, the first US purchase of yen since the coordinated G7 action of 2011. What that does to my FX page is further down, and it is not small.
Then, late Saturday night:
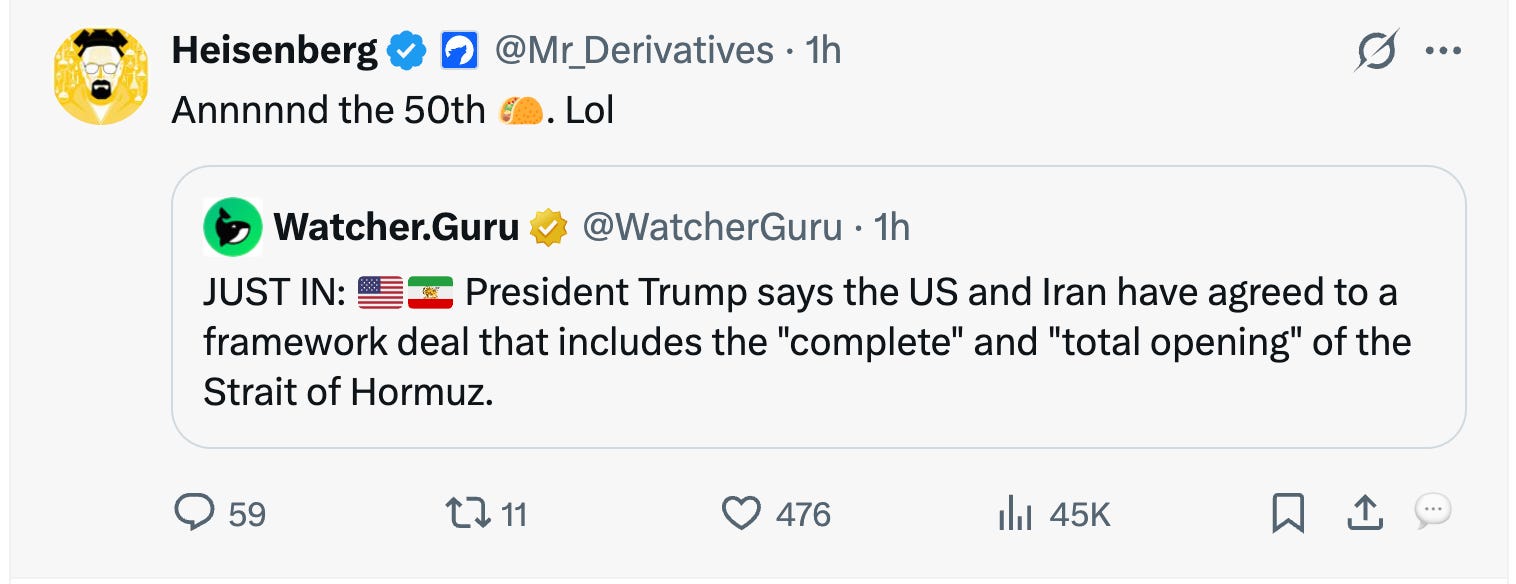
Iran denied it within hours. A military source told the Fars agency there is "no agreement on reopening the Strait of Hormuz," and added that any passage would need clearance from the Revolutionary Guard's navy. This is the third reopening announcement of the year. April's version lasted two weeks. June's was signed at Versailles and collapsed in three.
So Monday's job is to check the announcement against the tanker count, currently five transits a day against a normal 140. And through all of it, one market ignored every word spoken this week: bonds sold off through the Fed, through the earnings and through the headlines, to 4.75% on the 10-year, the highest of this move.
To get the most out of these market recaps and understand the framework behind my observations, I encourage you to read about my methodology here.
📊 Market Health
The composite score recovered to 34 from 29, and the McClellan summation, which measures whether selling pressure persists from day to day, cut its deficit from -546 to -253. That part is real, and it matters more than the score itself. A summation falling week after week means sellers keep showing up regardless of price; a summation halving its deficit means they stopped pressing. The sellers who controlled this tape for two weeks stepped back midweek, and what worried me most last Sunday broke first.
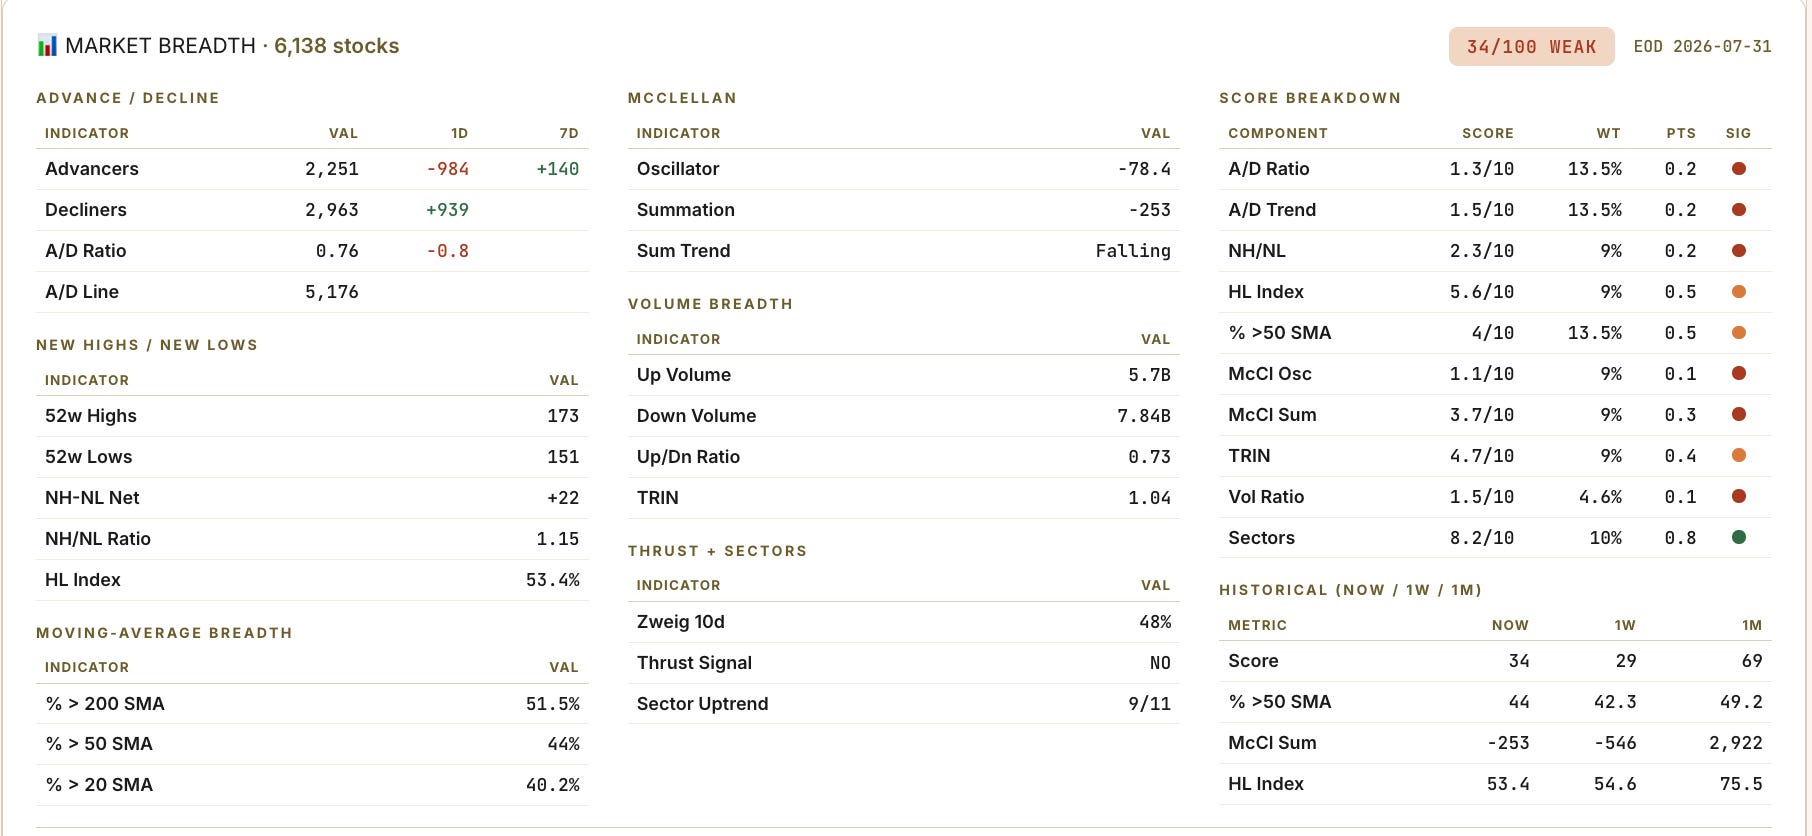
Friday bothers me more than Wednesday did. Wednesday was fear, and fear I understand. On Friday the index rose 0.7% while 2,963 stocks fell and 2,251 rose, and more volume traded down than up, 7.8 billion shares against 5.7 billion. An index can only print that combination when its biggest members are large enough to outweigh everyone else, and this week two of them were. New highs still beat new lows, 173 to 151, but that margin of 22 names is the thinnest of the summer. Meanwhile the share of stocks above their 200-day average has been stuck at 51.5% for two straight weeks, a majority by a point and a half that refuses to become anything more. I have seen tapes like this resolve both ways. When that number finally moves, I will believe whichever direction it picks.
Less selling is not the same thing as buying.
That is the whole diagnosis, and it is why the score still reads WEAK.
🚨 Sector Rotation
Last week's leader is this week's casualty. Utilities led this board seven days ago at 69.9% internal strength. They sit tenth today at 29.8%, down 4% in price in a week the index rose, a forty-point collapse in five sessions. Nothing about their business changed. What changed is the 10-year at 4.75%. A utility is priced like a bond: slow, regulated cash flows that investors buy for the dividend. When Treasuries pay 4.75% with no business risk, a dividend near 3% with rate risk attached loses its buyer, and the exit is always faster than the entry. Real estate runs on the same arithmetic, plus debt to refinance, which is why it cracked a week earlier; it slid further to 48.3% this week. The rate-sensitive groups are breaking in the order of how much they depend on cheap money, and that order is the most honest tell on this board.
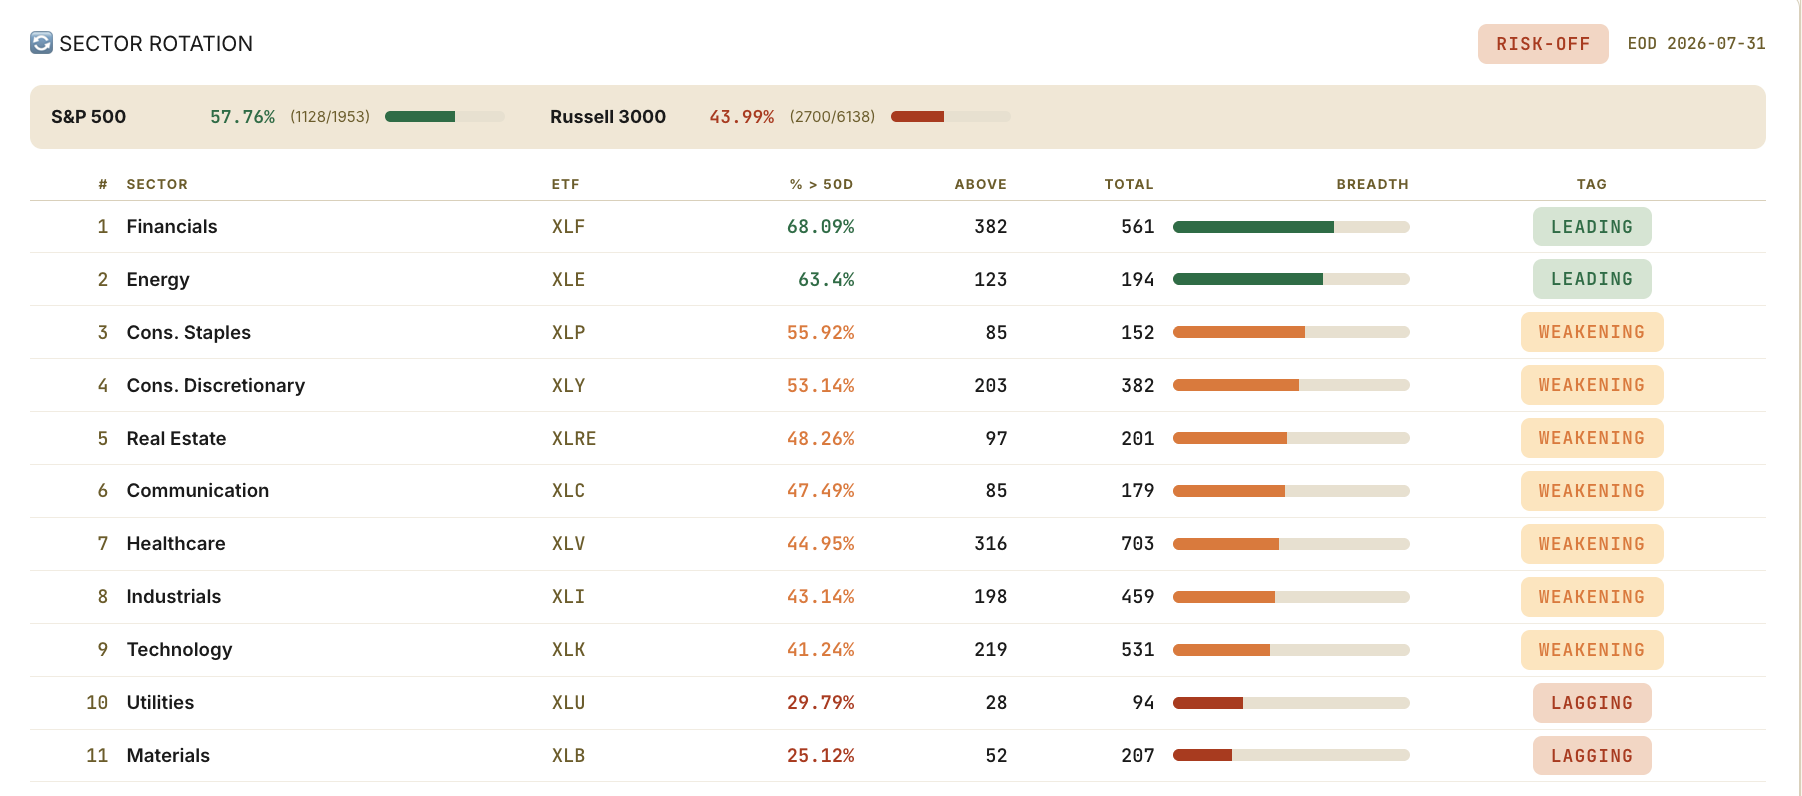
What held is what benefits from higher prices. Energy kept second place at 63.4% with the strait shut, and Saturday’s deal news makes it the seat to watch first on Monday: if tankers actually move, the group that led on war risk has to reprice, and its internals will tell you within two sessions whether the leadership was oil price or something more durable. Financials lead at 68.1%, and theirs is the one rotation with proof behind it: the banks reported strong earnings three weeks ago, and the money that left tech has stayed with them through every headline since. That is what an earnings-backed rotation looks like, and it is the difference between financials at the top of this board and utilities, which got there on fear and left on arithmetic.
Below the leaders the floor is dropping. Only 4 of eleven sectors keep a majority of their names above the 50-day, down from seven last week, and the regime tag reads RISK-OFF. Seven days ago I could tell you the rotation was healthy because the money kept choosing new seats. This week the choice narrowed to two seats and the rest of the theater emptied a little. That is still rotation, but it is rotation with less room for error.
Positioning through payrolls without guessing the number: if yields keep rising, energy and financials keep working and utilities stay broken, whatever bounce they print. If yields fall, the beaten rate groups bounce hardest, and I would trade that bounce with a stop, because a bounce built on one payroll print is fragile until the trend in yields actually turns.
Two corrections so the table does not mislead you. Discretionary’s 6% week is mostly Amazon’s index weight, its internals sit at 53%, middle of the pack. And technology improved to 41.2% in a week Microsoft added 21%, which means the median tech stock went nowhere while the biggest one repriced. Both sectors look better in the price column than they are underneath.
🔍 Pairs Alignment
The newest divergence measures the week exactly: cap-weighted QQQ against its equal-weight version, stretched to 1.35 standard deviations and widening. Same hundred companies, different weights, so the gap between the two is pure concentration, with no sector story or macro story to hide behind. My board gives this spread a half-life of about 20 trading days, meaning stretches like this one typically decay within a month, and the decay can come two ways: the median stock catches up, or the leaders come back.
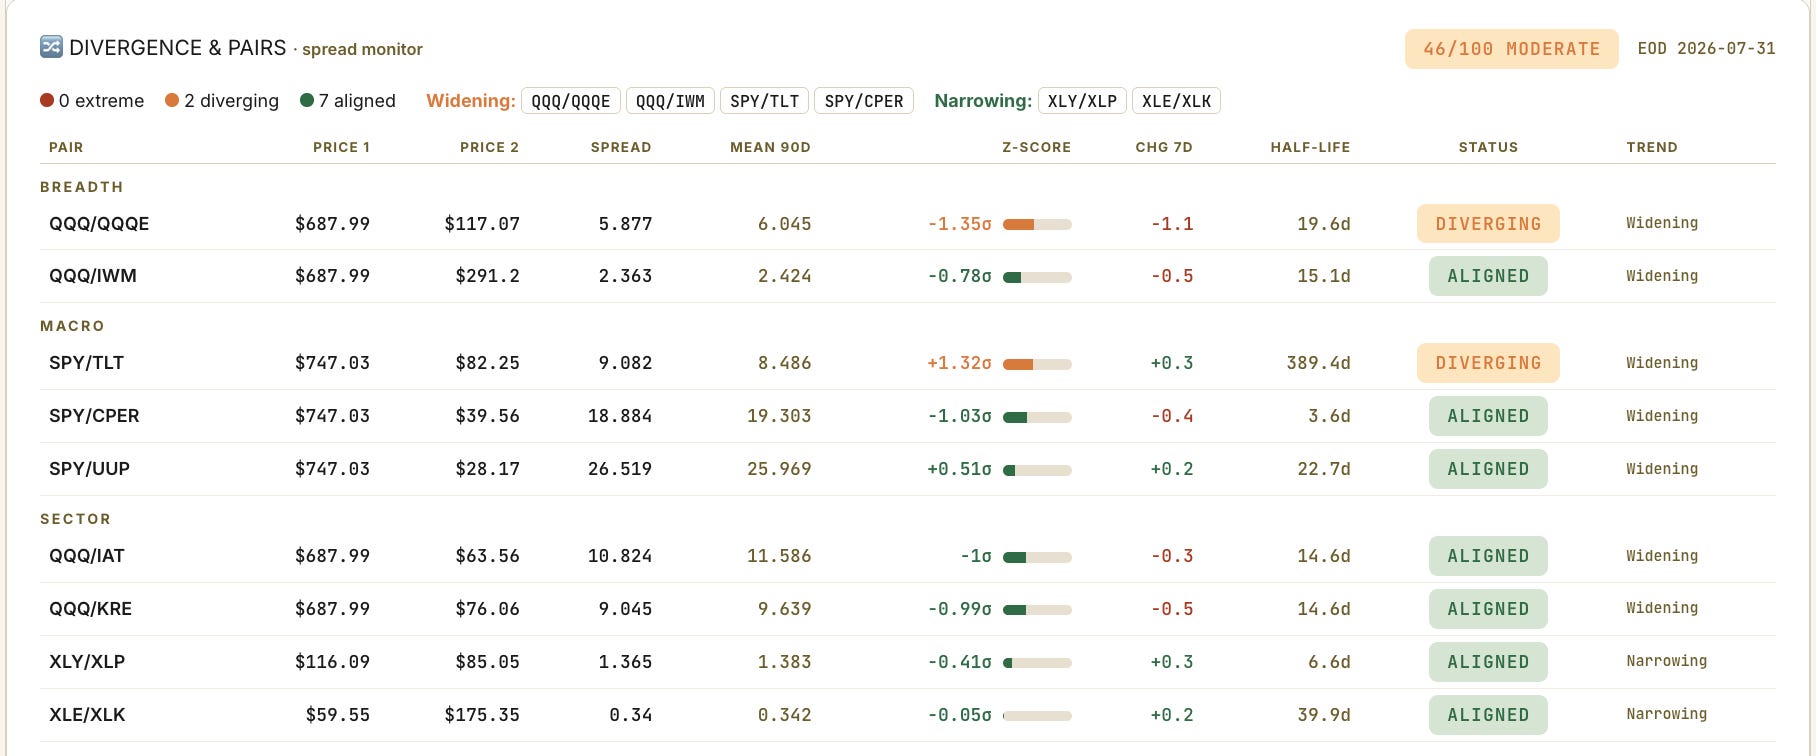
Stocks against long bonds is the pair that matters: still diverging at 1.32 sigma, because bonds fell again in a week stocks rose. There are only two ways this spread realigns. Yields fall and bonds recover, which is the relief scenario. Or stocks fall to meet them, which is the squeeze. What it cannot do is stay here forever, and there is still no hedge in duration while it decides. Seven of nine pairs sit aligned, none at an extreme. My two live risks, rates and concentration, are being priced at the same time, and both show up on this one page.
📉 Volatility
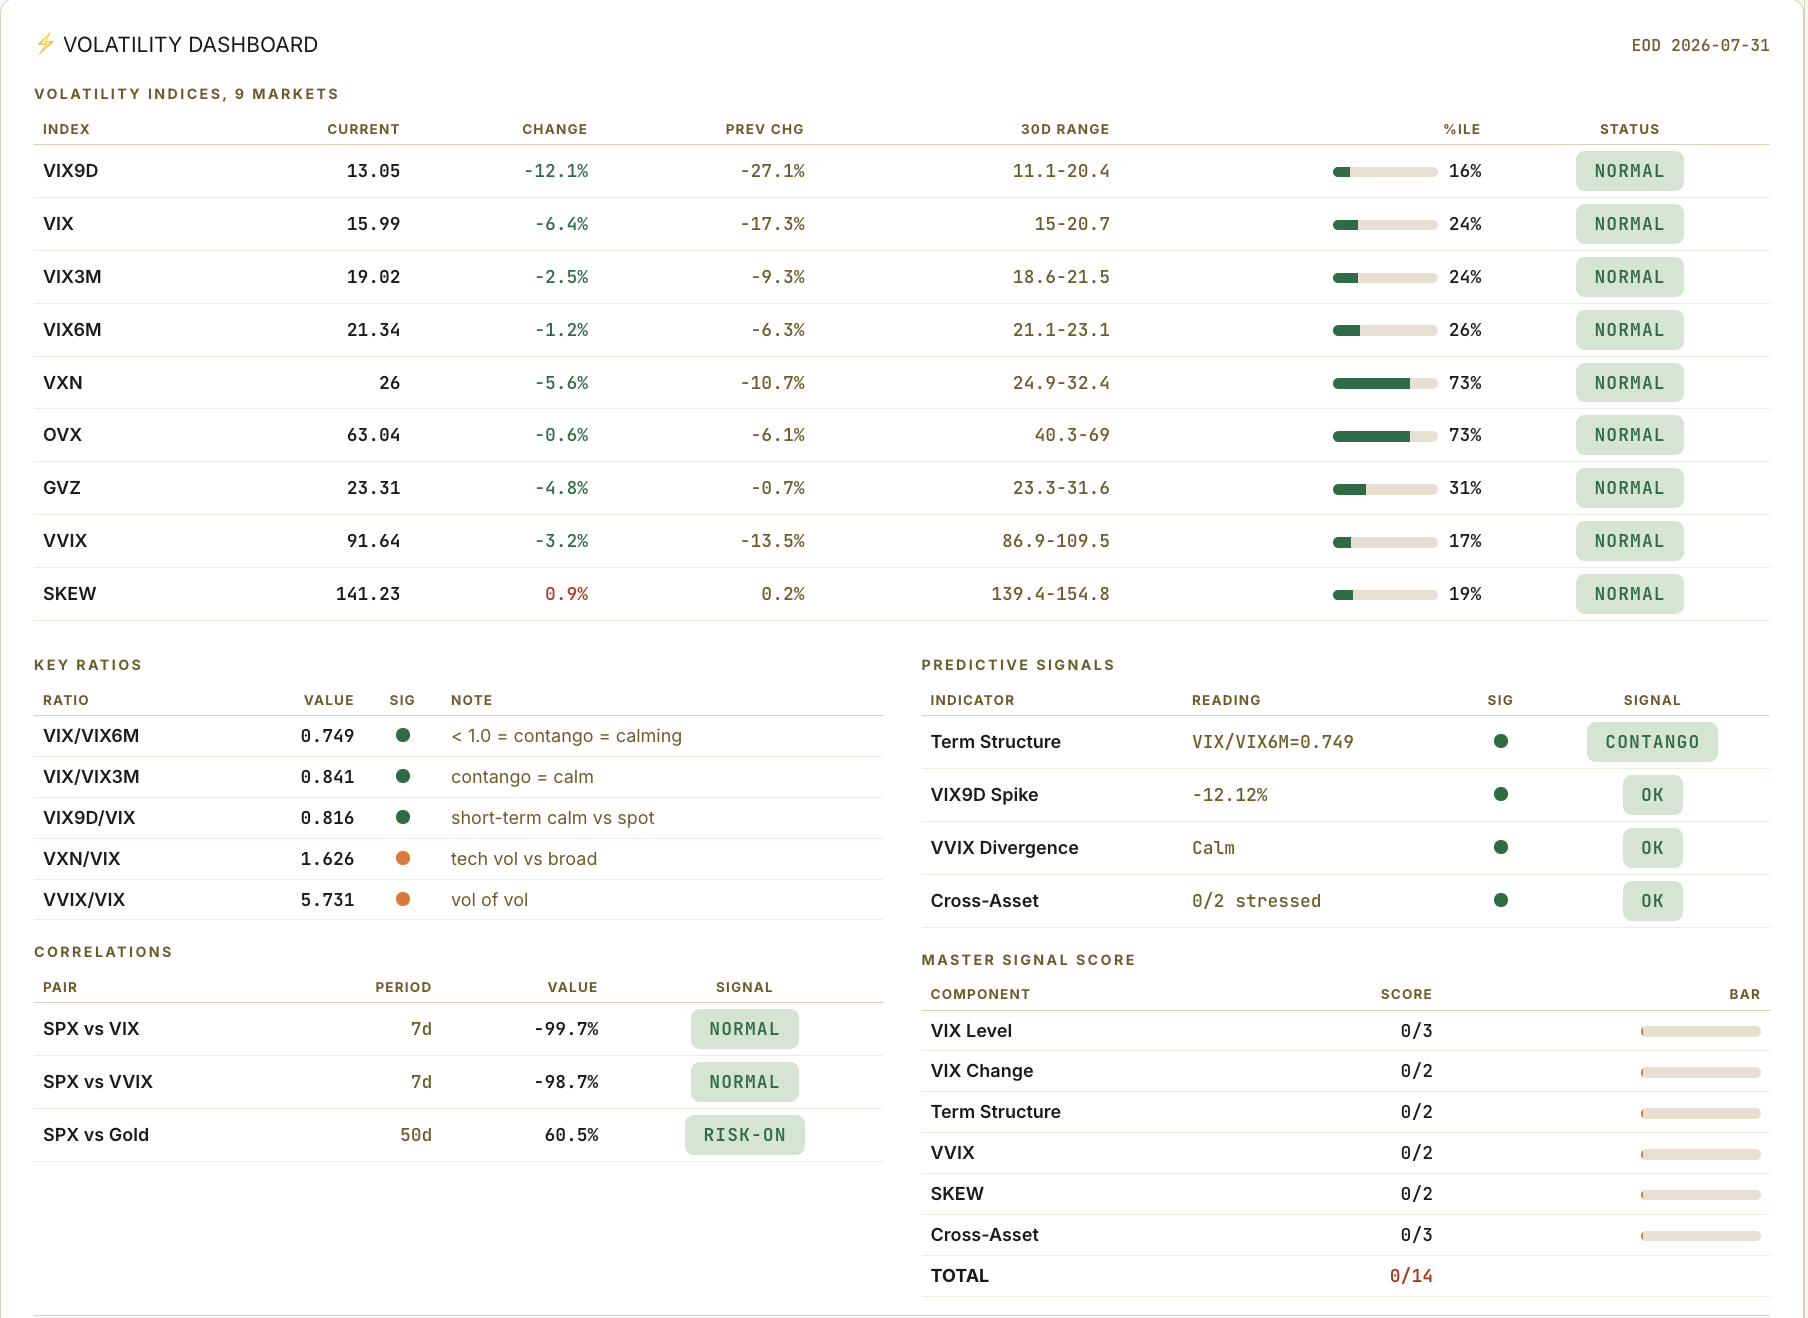
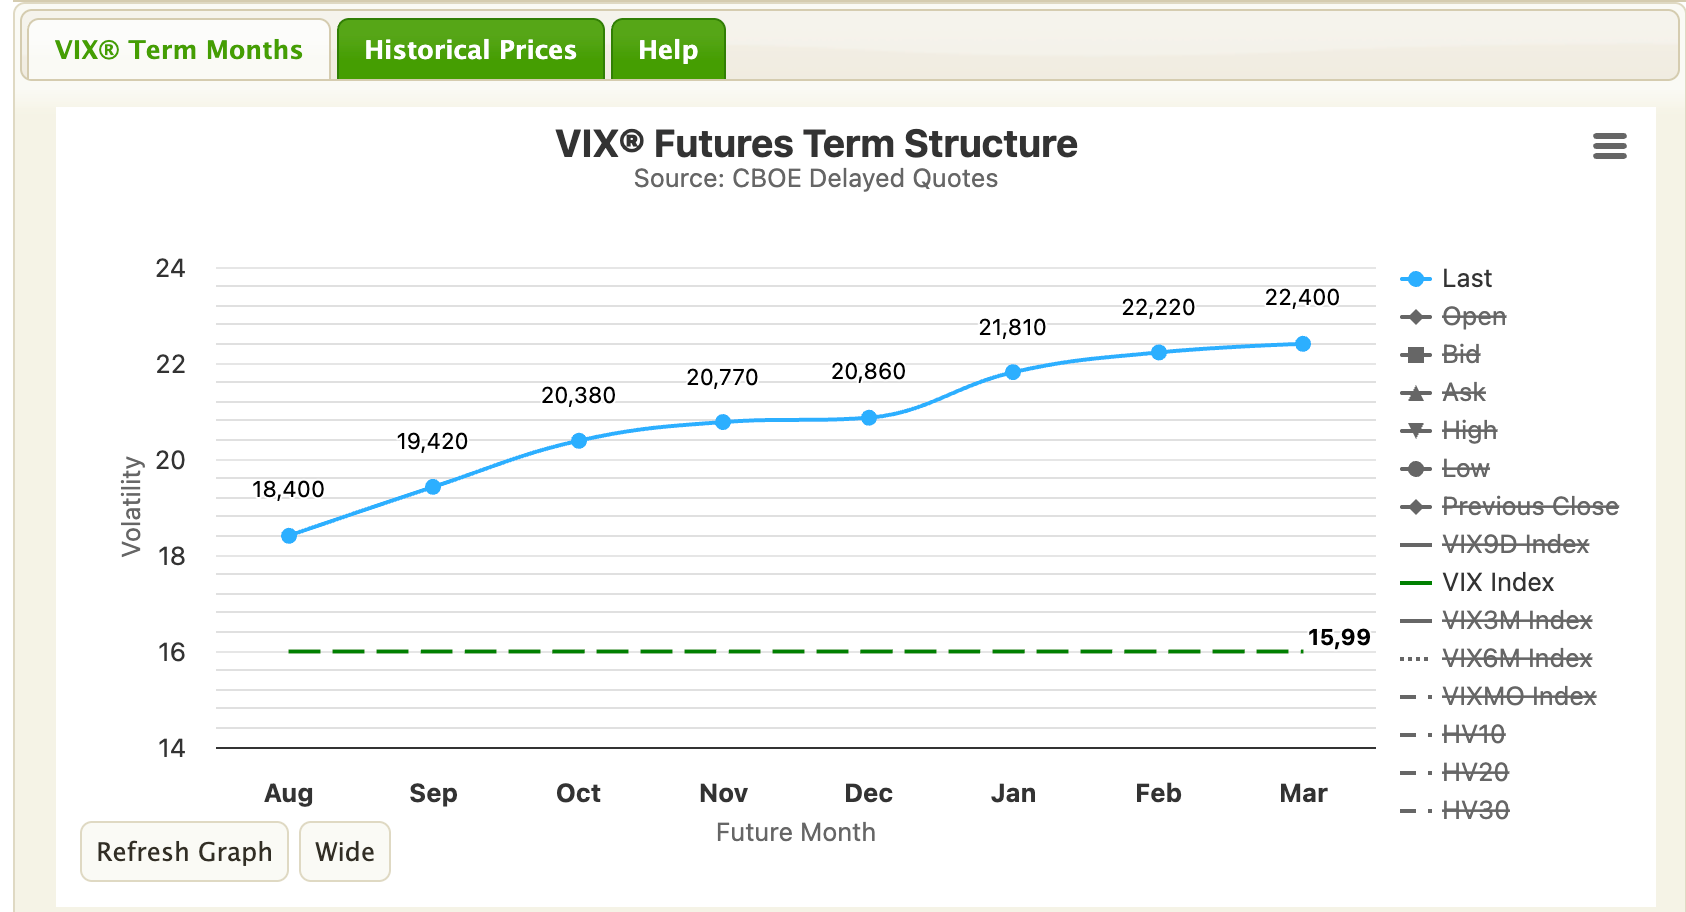
Wednesday cost the Dow 1,153 points. By Friday you could not find that session anywhere on this board. The VIX closed at 15.99, the 24th percentile of its year, after collapsing 17% on Thursday. The nine-day gauge sits at 13, the vol-of-vol index at its 17th percentile, the tail-risk gauge at its 19th, the curve in firm contango. Nearly every gauge on the surface sits below its own median; what stays elevated is Nasdaq vol and crude, and crude is the story.
The volatility market looked at three Fed dissents, a shut strait and two mega-caps gapping 15%, and priced all of it as finished business.
Crude vol is where the weekend matters. It eased 7% to 63 while the barrel went nowhere and the strait stayed shut, which on Friday looked like carelessness. After Saturday’s announcement it reads differently: the sellers of that insurance were pricing a deal before the deal was posted, the same way the tape often knows before the wire does. Last week I said crude vol was the one protection worth paying for. If the strait reopens, that premium goes to zero. If this deal dies the way April’s and June’s did, the premium comes back. Crude answers first, tonight at 6pm New York time when futures open.
💱 FX
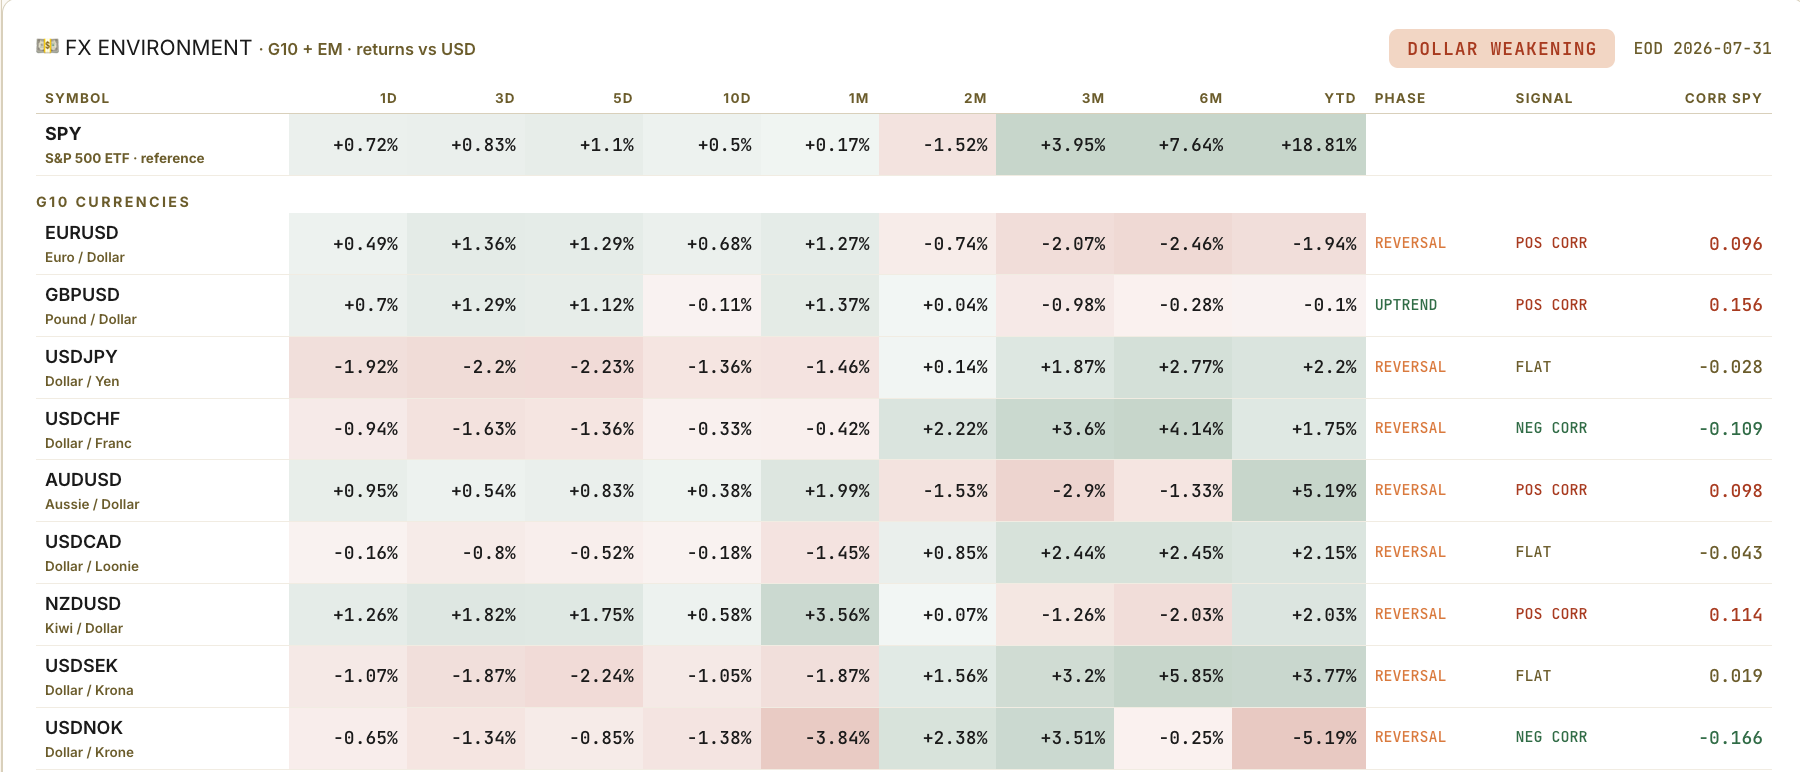
The dollar fell 1.4% in the week the Fed almost hiked, while the 10-year rose seven basis points. A currency that falls while its own yields rise means the selling comes from abroad, because higher yields would otherwise attract buyers, and it usually marks foreign holders reducing Treasuries rather than traders playing rate differentials. That alone was worth a line. Then the sellers got names, and the buyers did too.
Japan spent an estimated $59 billion on Thursday defending the yen from ¥162.84, its weakest level since 1986. On Friday the US Treasury joined, buying yen for the first time since 2011, executed through the New York Fed. The last time Washington did this, it was part of a coordinated G7 response to the Japanese earthquake. This time it is two governments against a market that has been selling the yen for years on the same simple trade: borrow cheap yen, buy everything else. A Reuters photographer even caught the Treasury secretary's notepad at Camp David: "To Do. Buy Japanese Yen, $5-10 bil." History says interventions of this size buy time, and only a change in the underlying policy, Japanese rates rising or US rates falling, buys a trend. Neither has happened yet.
The yen gained 2.2% this week, and in any normal week I would read that as a fear signal, the classic funding currency catching a safety bid. A price supported by two governments carries no signal. It tells me what officials want and nothing about what investors fear, so the yen line is dead to me until they step away, and every yen-based risk gauge, including my aussie-yen barometer, goes on the same shelf.
That leaves the franc as the only clean fear gauge on this board, and it moved: up 1.4%. Gold held above $4,000 through a vol collapse that should have pulled it lower. I am watching the franc line before any other.
🧠 My Take
This market pays for proof and sells promises. It paid Microsoft and Amazon for revenue. It sold Meta for spending without it. It sold the dollar while the Fed talked tough, which is the market’s way of saying that words alone no longer clear. And it will grade Saturday’s deal in tankers, because the two previous deals this year opened the strait on paper and neither survived a month. There is even a clock on this one: the sanctions relief Iran won in June expires August 21, which explains why both sides suddenly want a framework, and why the next three weeks decide whether this announcement was the real one.
The calendar thins out and sharpens. Six of the seven giants have reported; Nvidia remains, at the end of the month. Payrolls Friday at 8:30am is the only hard date on the macro side, with claims at 197,000 and employment costs at 0.9% for the quarter keeping hike odds at 67%. In between, ISM Monday, AMD Tuesday night, Disney Wednesday morning, and a tanker count every single day.
Grind and rotate, 40%
Payrolls print warm, the deal stays ambiguous, and the money keeps paying financials, energy and the two proven clouds while utilities sit broken. Breadth holds its thin majority above the 200-day and the summation keeps healing. Base case because sellers eased all week, and because a vol surface priced almost entirely below its median rarely hosts a crisis the following week. In this tape I add nothing broad and keep working the leaders.
Relief, 35%
Upgraded by the weekend, and capped there by the record. The strait reopens and the tanker count proves it, crude gives back the war premium, hike odds fall, and the median stock, flat for a month, finally moves. The equal-weight index leads, the beaten rate groups bounce hardest, and the 200-day share breaks upward out of its freeze. I cap it at 35 because April’s deal lasted two weeks, June’s lasted three, and Tehran denied this one within hours of the post.
The rate squeeze, 25%
A hot payroll number sends the 10-year toward 4.9% and hike odds toward certainty, and the selling turns broad through valuations, reaching every sector at once instead of one rate-sensitive group at a time. Utilities and real estate already showed the mechanism; in this scenario it stops being selective. Cutting exposure matters more than picking sectors here. A weekly close above 4.90% on the 10-year promotes this to base case.
🔥 Trade of the Week: BKR 0.00%↑
First, the book. Alphabet, bought around $319 last Sunday, closed at $356, up 11% and through the first target. The $342 gap filled Friday, a third comes off by plan, the stop rises from $296.60 to the $319 entry, and the rest rides toward $366 with the runner at $402. The calmer version of the trade, waiting for the Fed to clear, cost 11%. And if you sold everything at $342 instead of a third, congrats, five days is a fine holding period and nobody argues with a paid ticket. I keep a runner because the story that repriced this stock is four days old.
Now this week. The company cashing everyone’s checks just printed a record order book.
The setup
Baker Hughes reported last Sunday and beat by 31%, its fourth beat in a row. The line that matters sits below the earnings: orders of $10.5 billion, up 49%, a company record, including 76 gas turbines for data-center power, about 1.3 gigawatts, plus a multi-year deal for another gigawatt of the same. It also closed its $13.6 billion purchase of Chart Industries the same week, doubling down on gas and power infrastructure.
Read that order book against the earnings week. Amazon raised its capital budget to $220 billion, Meta to as much as $145 billion, and a data center orders its power equipment before almost anything else, because without electricity the chips are furniture. Baker sits on the receiving end of the same checks the market just spent two weeks repricing, and unlike the platforms, it books them as orders today rather than as promises of future revenue. Its sector holds the second leadership seat on my board at 63.4%, one of only two groups still leading.
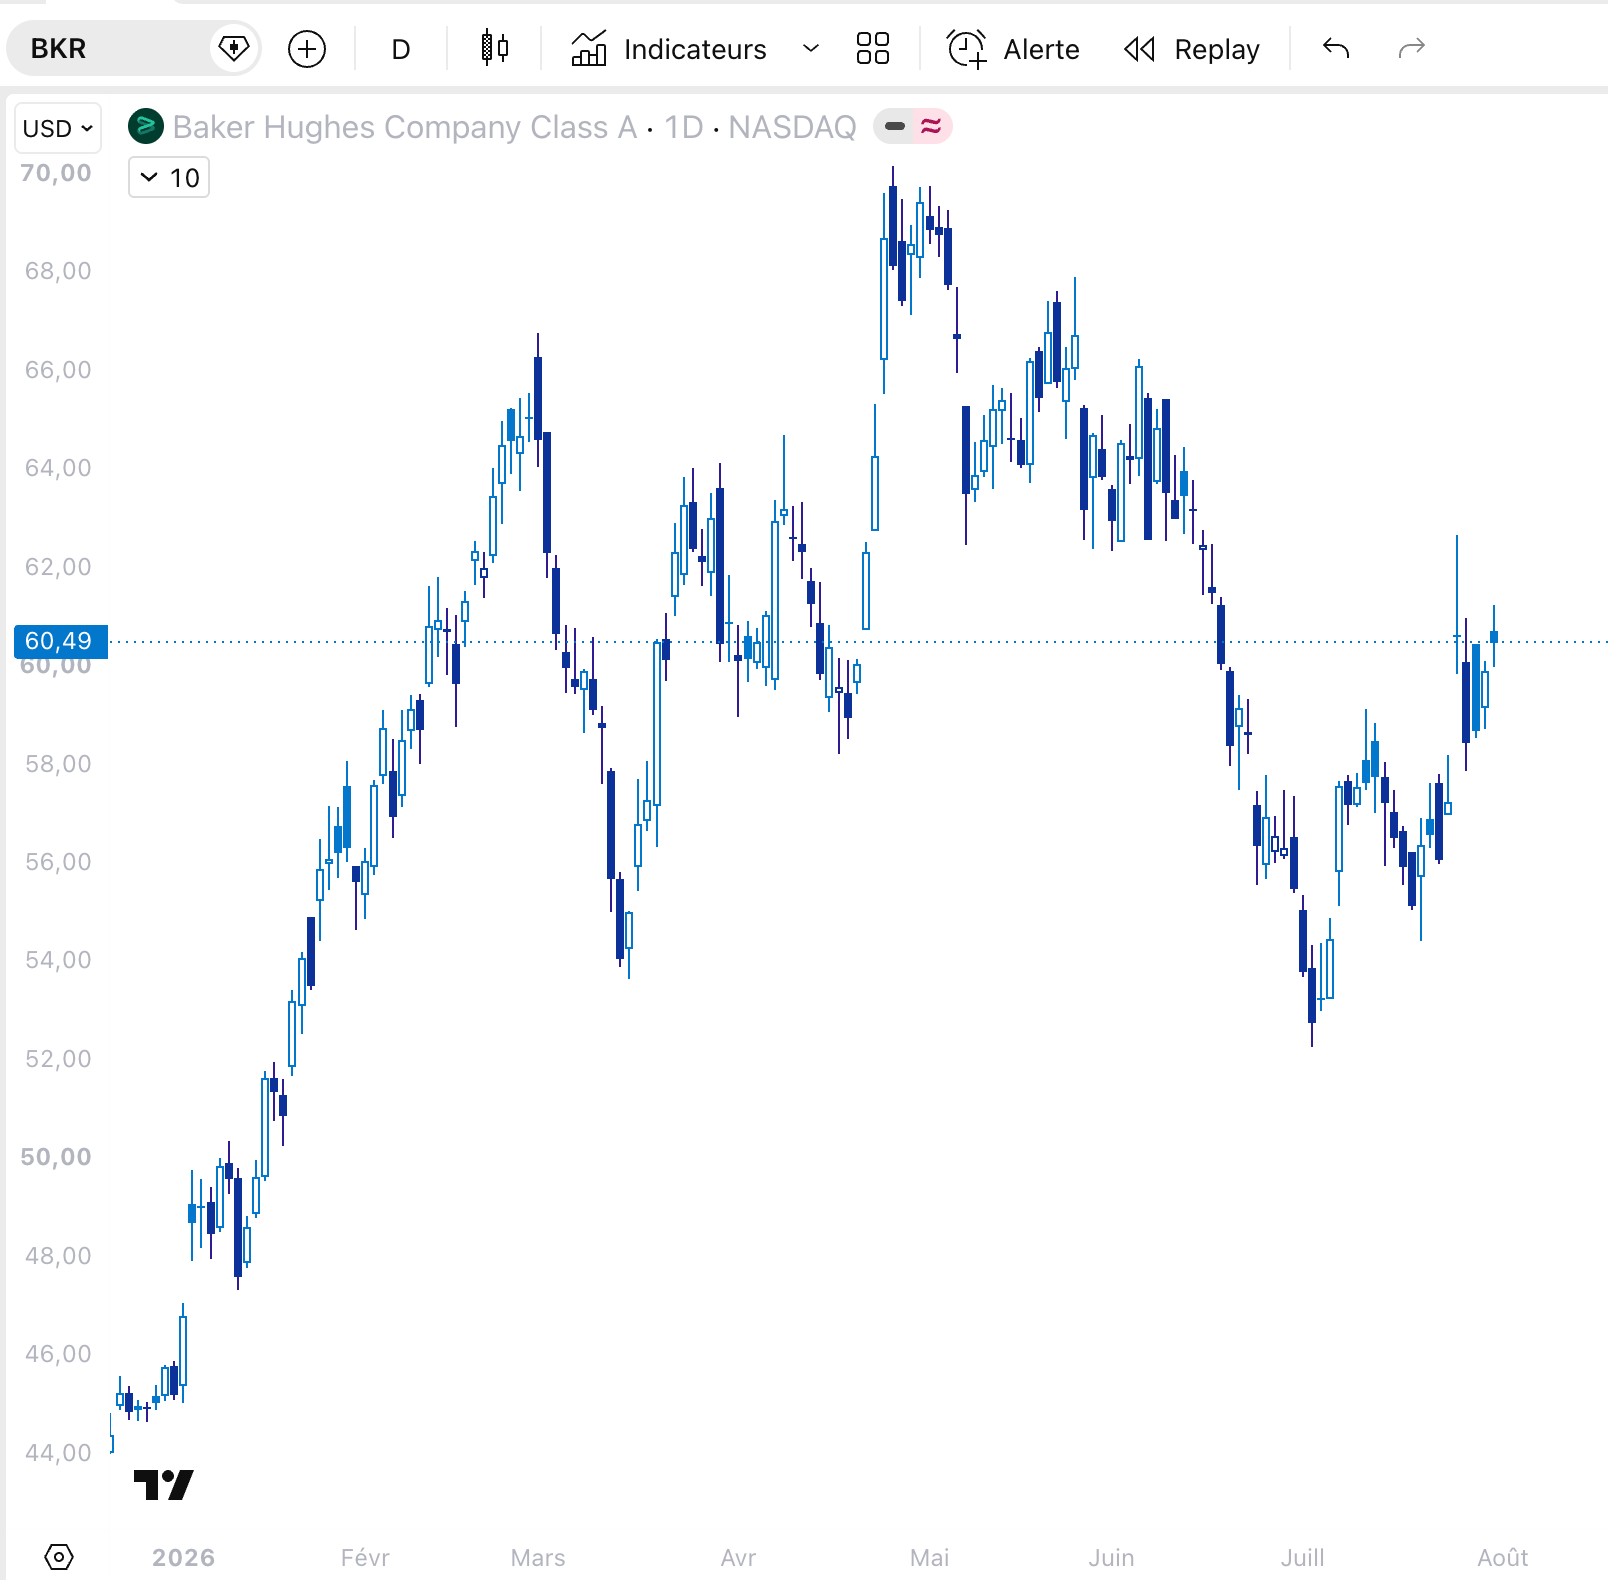
The stock jumped 5.8% Monday to $60.59, pulled back to $58.46 Tuesday, and closed the week at $60.49, a dime under its day-one close. That pattern has a name in the research: post-earnings drift. Investors underreact to large surprises, and stocks that beat big tend to keep moving in the direction of the surprise for weeks afterward. Five days in, this one has not even reclaimed its announcement-day close, so the drift, if it comes, is all still ahead. The stock reclaimed its 50-day average, the 20-day is rising underneath, and the April high at $70.41 leaves 14% of room overhead that the market’s extended leaders no longer have.
The honest part
The weekend added a risk, so it goes first. If Saturday’s deal holds and the strait reopens, energy gets sold before anything else, and BKR trades inside that sector no matter how good its order book is. The order book is also the defense, because data centers buy turbines whether crude trades at $70 or $90, but sector flows do not read order books on day one. So no entry in Monday’s first hour. I let the market grade the deal, then I use the levels.
The rest was already true on Friday. Crude went nowhere all week and the service group lagged it anyway: Halliburton lost 3.3% over the same five sessions, so the group offers no cover if the tape turns. Friday’s candle was weak, higher volume with a close in the bottom third of the range, which reads as sellers using the strength. Payrolls lands Friday and everything cyclical answers to it.
The levels
Entry: around $60.50, half there, half toward $58.50 on a retest of the earnings-week low.
Stop: a close below $57, under the weekly volume point of control, the price where last week’s heaviest business was done. A close below it means the market has fully unpaid the beat, and the idea is dead. No averaging down.
Target 1: $63
Target 2: $65.50
Stretch: $70
Sizing: small. A cyclical recovery trade into a payrolls Friday, in a tape carried by two stocks, with a live geopolitical coin flip over its sector, earns half size.
If options interest you more than shares: September call spreads struck above $57 do the same job with the stop built into the premium. I have no edge on your exact strikes. Size it like the shares, not like a lottery ticket.
See you next week,
Daniel
P.S. The app is the daily version of what you just read, the same boards and screeners I run every morning before I trade. It now comes with a free 7-day trial.
Disclaimer
This newsletter is for educational and informational purposes only. It is not financial advice.
The content reflects personal opinions shared publicly as a journal. Trading stocks, options, futures, or any financial instrument involves significant risk. You can lose your entire investment. There is no guarantee of profit.
The author is not a registered investment advisor, broker, or financial professional with any regulatory authority including the SEC or CFTC. Always consult a licensed financial advisor before making any investment decisions.
By reading this newsletter, you accept full responsibility for your own trading and investment choices. Past performance does not guarantee future results. Markets are unpredictable.
Screenshots are courtesy of TradingView, VixCentral, and other platforms with which the author has no affiliation. Information shared may contain errors or become outdated quickly.
This content is the intellectual property of the author. Copying or redistributing without permission is prohibited.
By continuing to read, you acknowledge and accept these terms.
he utilities collapse on your board, 69.9% to 29.8% in a week, is the live version of something 69 asset managers have been saying all month: Government Bonds sit 38.9% underweight on the same "structurally higher rates" thesis your 10-year at 4.75% just confirmed with a chart instead of a survey.
A monthly consensus and a real-time internals read rarely reach the same conclusion from opposite directions. When they agree this cleanly, what happens to the rest of the rate-sensitive names once bonds turn is the thing worth watching.